转贴:https://bursabuzz.blogspot.my/2018/05/kps-saga-should-be-settle-and-sky-is.html?m=1
转贴:
$KPS / 5843 (KUMPULAN PERANGSANG SELANGOR BERHAD)
As finally Pakatan rule the central government, the water issue of Selangor and the KPS saga should come to the end, anything is possible for now, Sky is the limit.
First TP RM1.75, second TP RM1.95, third TP RM2.50, ultimate TP RM3.5
只是分享,投资自负。
Perangsang Selangor through its 100% wholly owned subsidiary Nadi Biru Sdn Bhd ("Nadi Biru") owns 60% stake in Smartpipe Technology Sdn Bhd ("Smartpipe"). Smartpipe offers world class compact pipe technology for pipe rehabilitation. Smartpipe was granted a license by Netherlands-based Wavin Overseas BV ("Wavin") to market, sell and install plastic pipe systems and other patented produtcs in Malaysia. The invesment will provide an opportunity for Perangsang Selangor to participate in the non-revenue water projects as Smartpipe offers integrated solution to water and other utility companies through its innovative and proven technology. The major advantage is that this technology uses a trenchless pipe rehabilitation system produced by Wavin called a "Compact Pipe" system that substantially reduce leakages at joints, allows for less excavation work, minimal traffic distruption, ability to accommodate curved or twisted tracks and has a quick instalation time.
Perangsang Selangor owns a 51% equity stake in KPS-HCM Sdn Bhd("KPS-HCM") focusing on road and highway construction, rehabilitation, upgrading, operations and maintenance, rioad recycling technology and building works. KPS-HCM succesfully completed a 7 years Long Term Contract for the Selangor State Road Maintenance in 2015. A new contract was awarded in July 2017 to KPS-HCM for the infrastructure works for the development of Phase 3C in Pulau Indah Industrial Park. The scope of work include road and pavement, drainage and sewerage rectification works and deployment of flood mitigation pond.
Perangsang Selangor hold 30% equity stake in Syarikat Pengeluar Air Selangor Holdings Berhad ("SPLASH") via wholly-owned subsidiary, Viable Chip (M) Sdn Bhd.
Perangsang Selangor has investments in infrastructure including 20% equity stake in the SPRINT Highway that was designed to ease traffic congestion on the western part of Kuala Lumpur.
g:
Perangsang Selangor, through its wholly-owned subsidiary, Perangsang Oil and Gas Sdn Bhd owns a 40% equity stake in NGC Energy Sdn Bhd ("NGC Energy"), a joint venture between Perangsang Selangor and the National Gas Company, Oman which commands the second largest market share of the liquefied petroleum gas ("LPG") business in Peninsular Malaysia.
h:
Perangsang Selangor, through its wholly-owned subsidiary, Perangsang Oil and Gas Sdn Bhd owns a 40% equity stake in NGC Energy Sdn Bhd ("NGC Energy"), a joint venture between Perangsang Selangor and the National Gas Company, Oman which commands the second largest market share of the liquefied petroleum gas ("LPG") business in Peninsular Malaysia. i:
Perangsang Selangor via its wholly-owned subsidiary, Perangsang Telco Sdn Bhd, holds a 34.35% equity stake in Ceres Telekom Sdn Bhd ("Ceres"). Ceres provides mobile voice and data telephony services, launched its first pre-paid mobile service under the Friendi Mobile brand in mid-September 2013.
转贴:Wow, a Malaysian company that's in the pulp & paper segment? Need to study more about the business! The industry is super hot at the moment. In Indonesia, 2 companies INKP & TKIM have been flying the past year, giving returns of +540% & 650% respectively. Although I don't think Muda produces the pulp & paper but instead purchase them as their raw material... Anyways lets see if this can be a gem.
Muda上游有500千吨加上下游现在有240千吨,过后接下来的几个月还有新的三架机器投产。单单Muda的下游240千顿,都已经值得两亿了,如果和Orna比较的话。Oji paper 才要刚建的上游新产能,450千吨的产能就要价12亿。现在Muda 500千上游吨产+240千吨下游产能才卖你6亿,价钱是否低估了? b)good comment from davidtslim: Summary
1)Muda has the highest capacity of paper mill (upstream) in Malaysia. It benefited from China Blue Sky policy (ban of waste paper import) which the selling price of their products have increased consistently from Q4’17 to Q1’18 while the raw material (waste paper) price has dropped. 2)The timely expansion of Muda in 2017 and 2018 (to be completed in Q3 and Q4) for its paper mill and corrugated plants coincident with the price surge of its product. This will further drive its profit growth especially in Q4’18 due to peak season of online retail shopping in Nov and Dec. 3)Since 2nd half of 2017, paper price in China has been rising, and remain elevated until now. This was caused by shutting down of plants to improve environment. As China is a huge consumer of paper packaging products, the price increase spilled over to international market 4)The demands in Malaysia for corrugated products will continue to grow especially Malaysia now serve as Alibaba’s regional e-commerce and logistics hub in South East Asia. 5)Based on the higher demands and selling price of paper mill products, profit margin of Muda should be expanded in 2018 and it may has some export opportunity. 6)Based on estimated EPS of 38 sen, with forward 12-month PEx of 10x, the fair value of Muda is estimated to be around RM3.8. 7)Muda2018 = (Upstream+downstream+trading) X (Expansion+price hike) = High_Profit_Growth Icon(Muda):my 2018 sailang stock http://klse.i3investor.com/m/blog/icon8888/154696.jsp
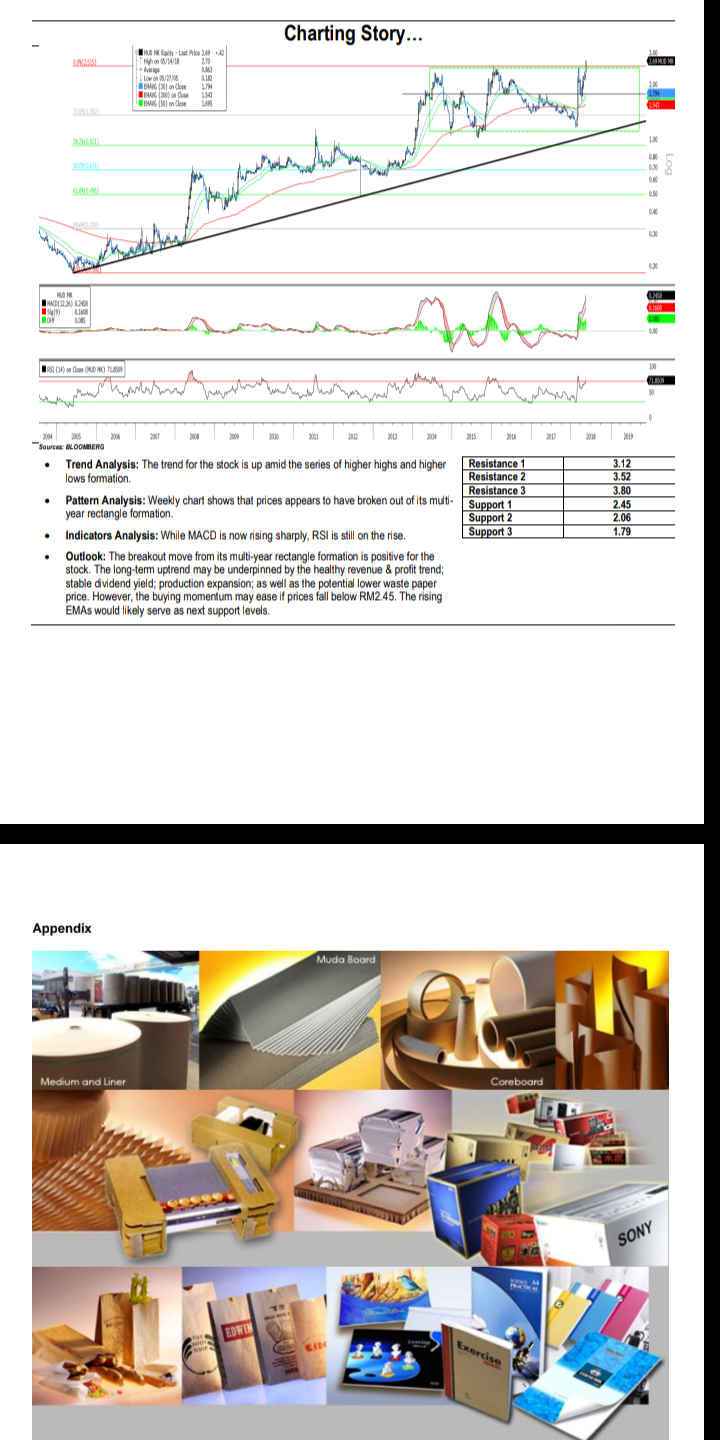
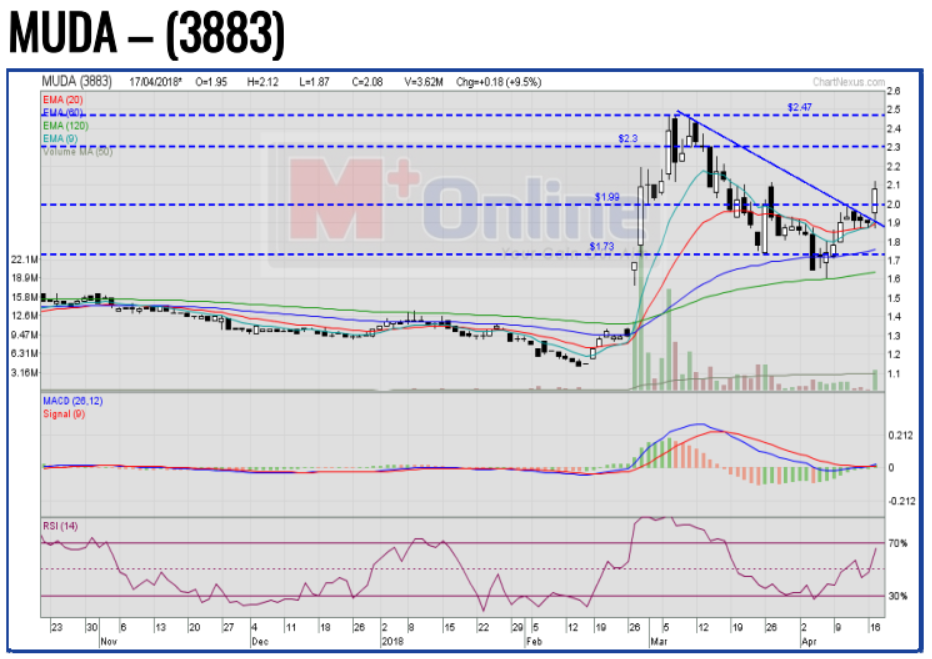
MUDA has experienced a trendline breakout above the RM1.99 level with high volumes. The MACD Indicator has issued a BUY Signal, while the RSI has risen above 50. Price may advance, targeting the RM2.30 and RM2.47 levels. Support will be set around the RM1.73 level.
Key takeaways from Annual Reports for ORNA and MUDA.
ORNA
MUDA
Overview
FY17 performance was due to increase in average selling price of corrugated boards and cartons boxes by ~18% and 11% YoY as the results of the continuous cost pass-through efforts. By contrast, paper price increased 19% YoY.
Improved product mix structure with higher premium cartons’ contribution to overall sales also contribute to higher average selling price.
Net sales volume increased YoY by 7.55% to 93,940MT pa (approaching the installed capacity of 100,000 MT pa) with notable demand from E&E, F&B and Furniture industries.
Overview
FY17 revenue increased 22.2% YoY due to the uptrend in the price of industrial paper and limited allocation from overseas manufacturers.
There is a constant shortfall in the domestic supply of waste paper which necessitated procurement for waste paper from overseas.
Completed new corrugating line in Kajang while one of the paper machines was stopped for capacity expansion from Sept 2017.
Capital expenses
No major capital expenses forecasted in FY18,
Capital expenses
Budgeted capital expenditure of RM100 million for 2018 (vs RM110m 2017) which is mainly for capacity expansion, upgrading and improving efficiency
Major expenses include the installation of new corrugating machines in Melaka and Johor Bahru, construction of a new factory in Air Keroh, Melaka with expected corrugating capacity expanded to 270,000 tonnes from 240,000 tonnes in FY17.
Prospects
Demand for corrugated packaging material is expected to grow more than 4% annually over the next five years
Will avoid dependency on single industry group and continue to diversify its customer and industry group base.
Aims to position itself as the green partner and to provide value-added services to its customer.
Prospect
The current downward trend in waste paper price is an added advantage for the Group as it is expected to cushion the impact of higher operating cost such as energy cost, labour cost and a potential hike in interest rate. Overall, the Group is confident that 2018 will be a profitable year.
Dividend
Declared dividend of 2.50 sen per share (ex-date 28/6/2018). Total dividend for FY17 5.00 sen per share
Dividend
Declared dividend of 3.50 sen per share (ex-date 27/6/2018). Total dividend for FY17 3.50 sen per share
2018 has been a turbulent year thus far for the share price of HRC. However, is the same turbulence seen in the operations of HRC? In this article, lets attempt to estimate the profitability of HRC in the 1st Quarter of 2018.
1. SALES In estimating sales, cost of goods sold and gross profit of HRC for Q1 2018, the 3:2:1 Crack Spread approach is highly popular and favoured. This widely used crack spread ratio is based upon the premise that 3 barrels of crude oil produce 1 barrel of gasoil (diesel) and 2 barrels of gasoline (petrol).
a. Sales Price The daily historical data of the followings were obtained from CME Group's website for the quarter from 1 January 2018 to 31 March 2018: - Singapore Gasoil (Platts) - Singapore Mogas 95 Unleaded (Platts)
b. Sales Quantity Sales volume is determined as the average of the past 8 most recent quarters (1 January 2016 to 31 December 2017). In determining this average, quarters with the highest and lowest sales volume were disregarded to eliminate unusual fluctuations. Using the 3:2:1 Crack Spread ratio, daily diesel sales is estimated at 36,790 barrels while daily petrol sales amounted to 73,580 barrels.
c. Sales In RM Daily sales price extracted in US$ were converted to RM using daily foreign exchange rates extracted from Bank Negara's website. The daily sales price in RM is then multiplied with the sales quantity of diesel and petrol respectively on a daily basis, giving a sales revenue of RM3,058,775,000 for the quarter. Note: Detailed daily sales calculation has not been included here as it is voluminous.
2. COST OF GOODS SOLD Cost of goods sold is determined as Opening Inventories + Purchases - Closing Inventories.
a. Opening Inventories Based on the latest breakdown of inventories available as at 31 December 2016, 56% of inventories was that of crude oil, 41% of refined products while the balance 3% was of other materials. Applying this ratio (but ignoring the insignificant 3% of other materials), the breakdown of inventories as at 31 December 2017 is estimated as below: Cost of diesel and petrol is calculated based on Q4 2017 gross profit margin of 11.5%.
b. Puchases For presentation purpose, it is assumed that daily crude oil used in production of 110,370 barrels is purchased and replenished on a daily basis. As in the sales estimation above, daily prices of Brent Crude Oil were extracted in US$ and translated into RM using daily foreign exchange rates. This figure is then multiplied with daily sales of 110,370 barrels of crude oil, giving total purchases of RM2,624,104,000. Note: Detailed daily purchases calculation has not been included here as it is voluminous.
c. Closing Inventories For direct comparison, physical closing inventories is maintained per physical opening inventories. The opening inventories of 2.6m barrels of crude oil is able to last daily production consumption of 110,370 barrels for 24 days. At daily crude oil purchases of 110,370 barrels per day, closing inventories of crude oil is calculated based on daily prices of Brent Crude Oil extracted (in US$ and translated into RM using daily foreign exchange rates) for the last 24 days of March 2018 giving a value of RM707,805,000. For apple to apple comparison, gross profit margin of diesel and petrol are maintained at 11.5%. Note: Detailed daily purchases calculation for the last 24 days of Q1 2018 has not been included here as it is voluminous.
3. OTHER INCOME Other income is determined as the average of the past 8 most recent quarters (1 January 2016 to 31 December 2017). In determining this average, quarters with the highest and lowest other income were disregarded to eliminate unusual fluctuations.
4. MANUFACTURING EXPENSES a. Manufacturing expenses is determined as the average of the past 8 most recent quarters (1 January 2016 to 31 December 2017). In determining this average, quarters with the highest and lowest manufacturing expenses were disregarded to eliminate unusual fluctuations.
b. Manufacturing expenses for Q2 2017 was normalised due to expenses incurred for an unplanned maintenance shutdown. Manufacturing expenses is adjusted accordingly based on number of production days.
5. ADMINISTRATIVE EXPENSES Administrative expenses is determined as the average of the past 8 most recent quarters (1 January 2016 to 31 December 2017). In determining this average, quarters with the highest and lowest administrative expenses were disregarded to eliminate unusual fluctuations.
6. DEPRECIATION AND AMORTISATION Depreciation and amortisation expenses are determined as the average of the past 8 most recent quarters (1 January 2016 to 31 December 2017). In determining this average, quarters with the highest and lowest depreciation and amortisation expenses were disregarded to eliminate unusual fluctuations.
7. OTHER OPERATING GAINS On 23 January 2018, HRC took a new term loan amounting to US$430m (RM1.7b) to refinance existing term loans, to finance the planned 2018 capital expenditure and a revolving credit facility for working capital purposes. As at 31 December 2017, the outstanding US$ denominated term loans amounted to RM1,205,008,000. The foreign exchange on that date was 4.0620. The exchange rate as at 23 January 2018 was 3.9270. Assuming the new term loan was drawndown for full repayment on the said date, the realised foreign exchange gain for HRC amount to RM40,048,000.
8. FINANCE COST Finance cost is determined as the average of the past 8 most recent quarters (1 January 2016 to 31 December 2017).In determining this average, quarters with the highest and lowest finance cost were disregarded to eliminate unusual fluctuations.
9. PROFIT BEFORE TAXATION
10. TAXATION EXPENSE Depreciation is assumed as capital allowance for taxation purpose.
11. PROFIT AFTER TAXATION FOR Q1 2018
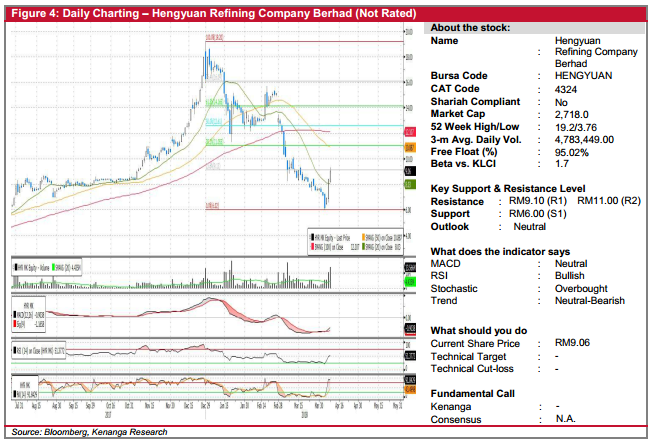
b) HENGYUAN (Not Rated)
HENGYUAN surged 71.0 sen (8.5%) to end at RM9.06. This was accompanied by 13.6m shares being traded – above average volume of 4.4m shares.
Positive movements in the past three days, backed by indicating strong volumes could indicate a potential bottoming-out.
Likewise, momentum indicators also displayed signals of possible reversal, i.e. RSI rebounded strongly from oversold territory, with uptick seen in the MACD.
The share is currently in the midst of testing its resistance at RM9.10 (R1). A break out from R1 could spark a further rally towards RM11.00 (R2) and RM12.60 (R3) further up.
Conversely, RM6.00 (S1) represents a crucial support, in which a break below is highly negative and could possibly trigger another round of free fall.
After my earlier posting on the drop of HengYuan, some followers were asking me how do I see in HengYuan. So, I am here to provide in depth analysis on this stock.
As I said earlier, I did warn that it is ridiculous when it was trading at the price near to 19. It justify my view by the drop from 19 to 6. So, now is the rebound phase and this has trigger the interest of the followers. Especially when Mr. Koon said he is coming back into HengYuan, this give the retail trader a confident booster.
I will see HengYuan from two different angles which I will elaborate at below.
Let see from Fundamental point of view :
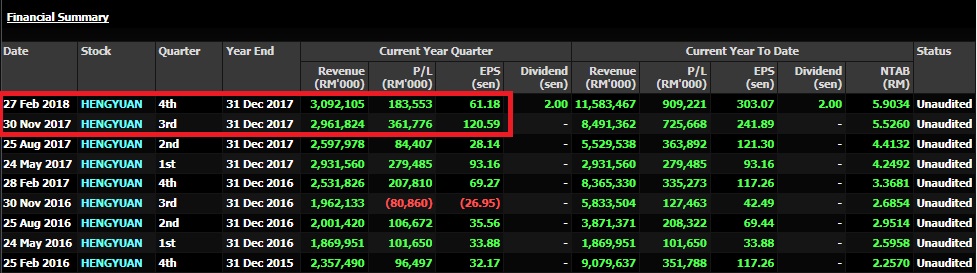
Fourth Quarter result release showing that a small improvement of revenue but profit drop approximately 50% which you can see earlier quarter EPS was 120.59 compare to the most recent quarter which is only 61.18. So, from this we notice the business remain the same but what is curious is the drop of nearly 50% of the profit which require you dig out more info from the quarterly report. So, coming quarter most likely will be release on 24 May 2018 base on the historical release date. Unless you are pretty confident which HengYuan will resume the growth momentum for the revenue and profit, else it will be risky to hold on your position unless got more than 20% PROFIT as your buffer.
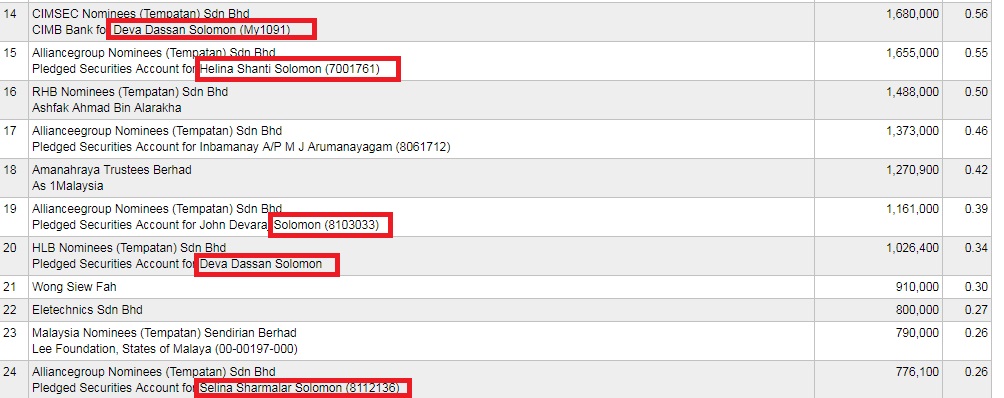
From the top 30 major shareholders which we notice Solomon holders name do appear very frequent as I printscreen attach as below. Name such as Deva Dassan Solomon, Helina Shanti Solomon, John Devaraj Solomon, Selina Sharmalar Solomon. Beside, Mr Koon Yew Yin, we should watch out closely Solomon family transaction.
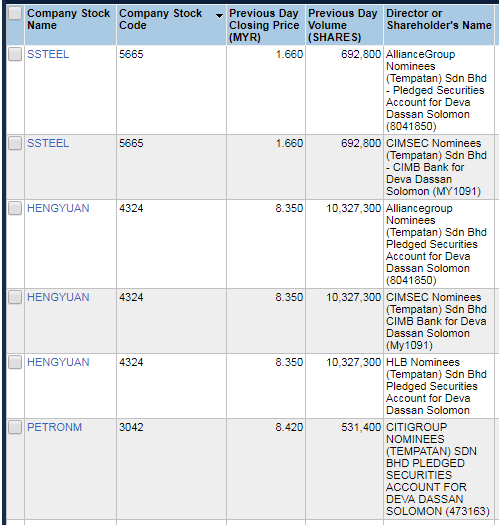
Below I provide the screen capture of using Insage Professional showing Deva Dassan Solomon shareholding we could find the stock he is holding is SSteel, HengYuan and Petronm.
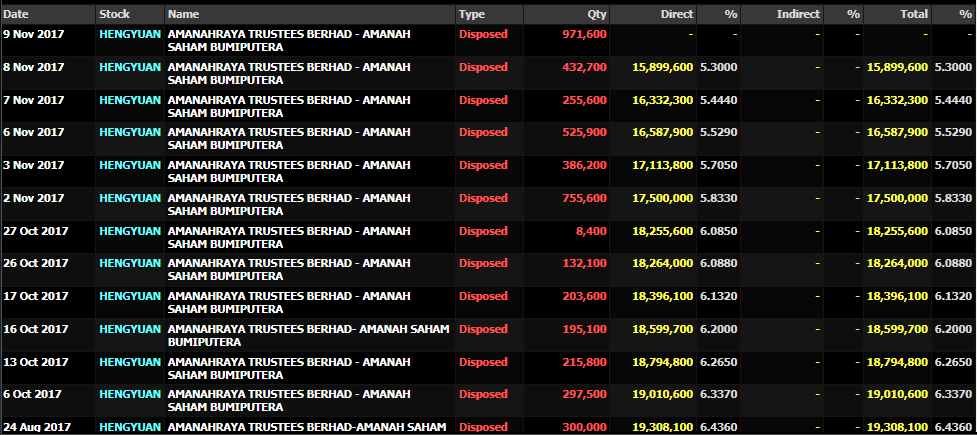
On top of that, we do notice actively disposal of HengYuan by Amanahraya Trustee Berhad – Amanah Saham Bumiputra. When the shareholding go below 5%, then it can move wild. Early alert for fellow HengYuan Trader. Technically speaking, the game is not over even with such huge drop from 19 to 6.
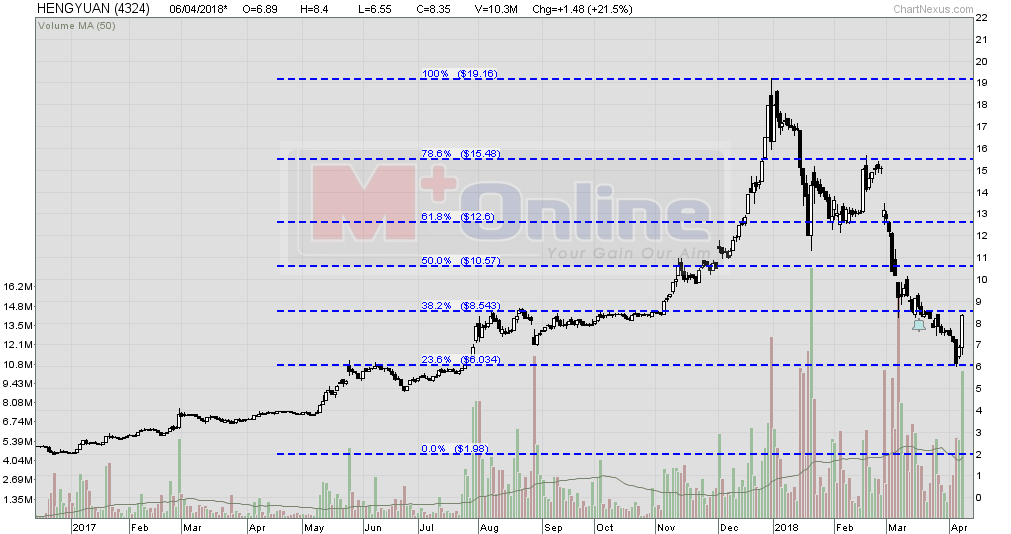
Technical Point of View :
HengYuan started the rally early year 2017 from the level 1.98 till 19.16. So, I am plotting the chart using Fibonacci Retracement which show you each support resistance if you have the basic knowledge how to read this. So, the first resistance level peg at 8.54. When it able to penetrate this level then we shall look at the psychological resistance at 10. If able to breakout with strong volume together with buying interest, then I am at 10.50 as the next resistance. From this level onward, I think anything go above will be extra for you. There is such thing in technical reading call cover gap. So, if would to cover previous gap down, then it is likely to rebound as high as 14. I would not expect it break above 15.48 level because if break this level. Then we can see bullish momentum and this definitely need to come together with a good revenue and profit. If this don’t happen, to me. 14 is more than enough. Nothing more than that. Anyone making more than 14 is crazy profit. You are rewarded for holding longer position than other.
It fulfill my 1 Cross 4 criteria ( Do attend M+Online Technical 101 course ) to capture the entry level detection.
Conclusion : if there is no external factor such as TRADE WAR getting serious, my personal view is HengYuan should ride on the uptrend then don’t hold when near to next quarter result date. That is my personal opinion.
Borrowing: Non Current RM 1,125,905,000 Current RM 79,103,000
Note: A19 Currency Profile of borrowing
USD as at 31.12.2017 RM equivalent: RM 1,205,008,000.
USD exchange rate on 31/12/2017 1 USD = 4.0592 http://hrc.com.my/index.php/hengyuan-refining-company-berhad-secures-favourable-financing-of-rm1-7-billion-usd430-million/
This was announced on 23-1-2018. Highlight below.
“The facilities are segregated into a term loan and a revolving credit line. The term loan will be utilised towards refinancing HRC’s existing term loan and also to partially finance its planned capital expenditure. The revolving credit facility will support the company’s working capital needs. The term loan will be repaid in instalments throughout the tenure of the 5 year facility. Approval for the facilities was received from Bank Negara Malaysia on 22 January 2018.”
This mean from the date Hengyuan refinance the USD loans with RM loans Hengyuan will not have any mark to market gain/loss in the USD loan to equivalent RM anymore.
Assume actual refinancing loans and repayment on USD loans was done on 1st Feb 2018.
USD exchange rate at 1-2-2018 1 USD =3.9004.
If we base on exchange rate different at 31-12-2017 and 1-2-2018. This Q1 2018 will have USD loan realized gain of RM 1,205,008,000 X ((4.0592-3.9004)/4.0592))= RM47, 141,128.
I believe the S&P long term contract signed with Shell is base of Petrol/Diesel pricing = Crude oil Price + Crack Spread. Crude oil price and Crack Spread will be base on mutually agreed publication available to public and settlement on monthly basis with weightage average of daily price and spread. Will seek board confirmation on the actual formula and which mutual agreed publication in reference to crude oil price and Crack spread? What is the breakeven crack spread?
This S&P contract was agree upon when the petrol and diesel retail price was fixed by Government on monthly basis since then it had been changed to weekly basis hence perhaps Hengyuan have the right to renegotiate to weekly settlement with credit term of 10 days instead of 1 month. If this is done then the trade receivable will reduce from RM 1.08 billion to 370 million an addition cash in bank of 710 million.
With the support of own jetty and pipeline and 78 refined product storage tanks and ability to import the refined products from China to fulfill contract with Shell. (As what they already plan to do with booked refine products at preferred rate during the major turnaround shutdown in Aug 2018 from 45 to 90 days max) Perhaps Hengyuan can reduce their inventory from 16 days cycle to 11 days cycle. Hence inventory can be reduced from RM 1.11 billion to 763 million an addition cash in bank of RM 347 million.
Hope this will answer everyone question whether Hengyuan have the ability to pay better dividend or Not?
Thank you. Have a nice week end.